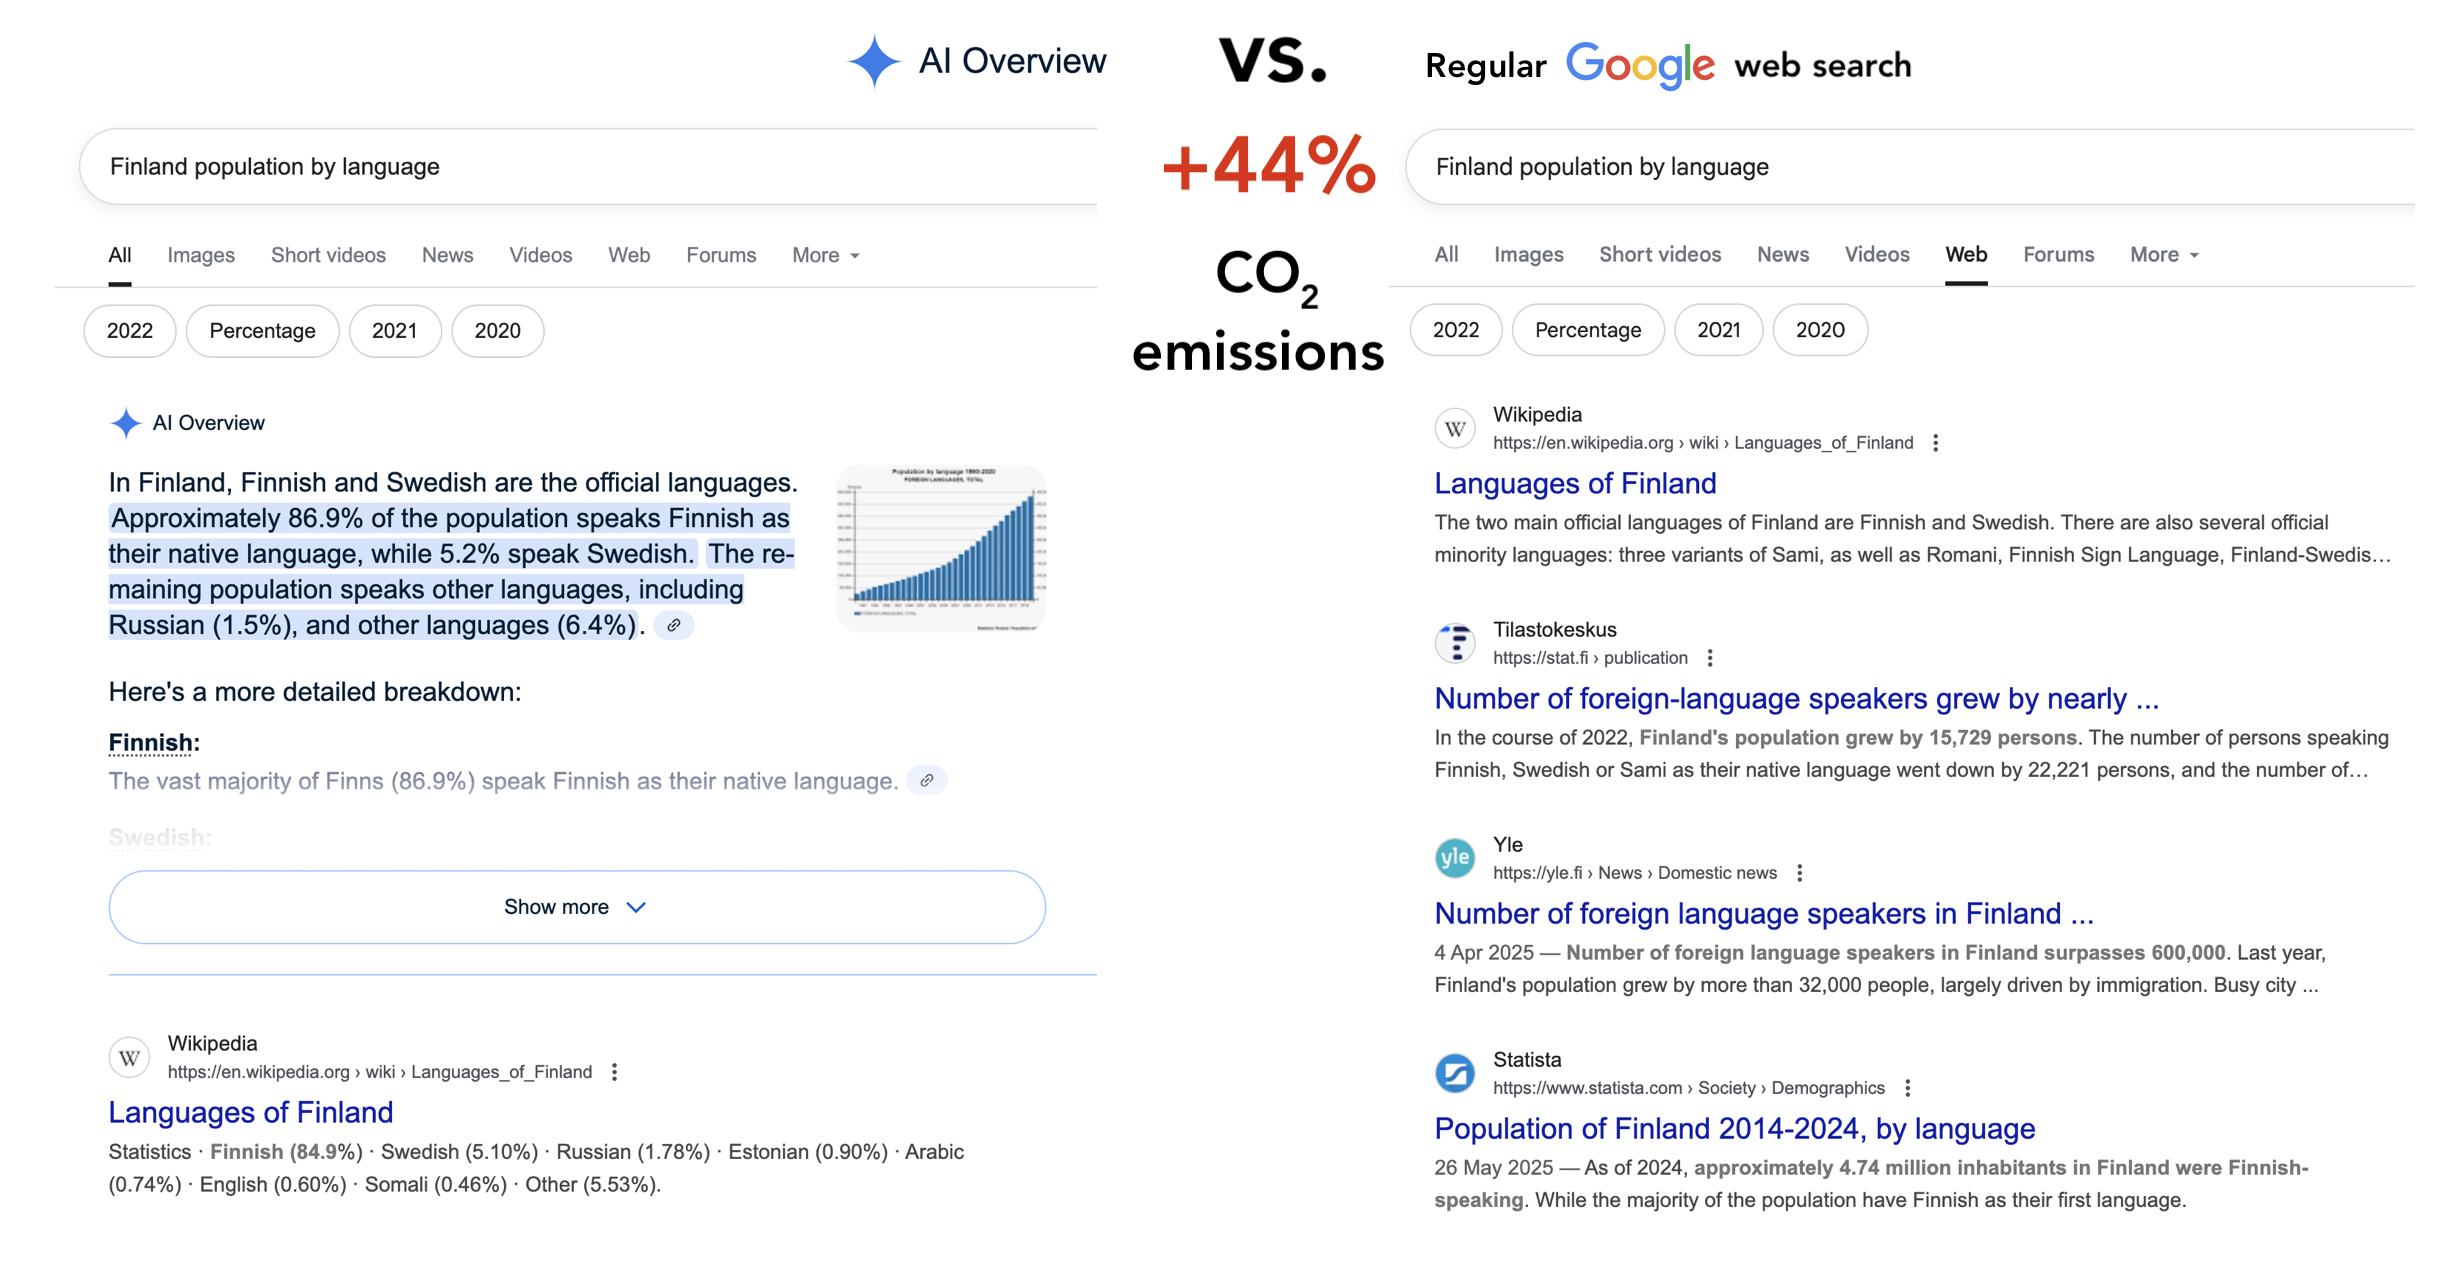
This study is based on programmatically running Google searches on a selection of categories. These searches, including AI overview and search features, were compared to "regular" Google searches (web filter, udm=14).
Search categories / intents used:
Comparing products
Finding "how-to" information
Self-diagnose of symptoms
Browsing cooking recipes
Speaking a foreign language
Tutorials or tips
Lyrics & music
Maps and navigation
Job seeking and recruitment
Ideation
News and weather
Travelling
Entertainment
Investing and economics
Search queries / keywords used (20 pcs.):
Battery life of iPhone 16
Difference between Pepsi and Coke
Finland population by language
Updating Windows 11
How to use Google Analytics 4 without cookies
How do I repair my TV remote?
Rose flower allergy
Potato salad ingredients
Most common phrases in French
Top services for game streaming
Songs Finnish classics
Rush hour in Helsinki
Job interview preparation
Example of birthday trivia questions
Wedding games
News services in Finland
Climate in Lapland
Travelling with kids best location europe
Fun activities bachelor party
Finnish stock market development 2020-2025
Source: Google.com
Technology:
seleniumwire (Python3)
User agent: Mozilla/5.0 (Windows NT 10.0; Win64; x64) AppleWebKit/537.36
Scenarios:
20 search queries / keywords
All queries run 10 times each
Sample size: 400 Google queries
1. AI Overview & search features
2. Web search filter (udm=14)
Results
Programmatically running Google search queries (n = 400) through two scenarios show that a "regular" web search (scenario #2) has a significantly lower number of requests in comparison to the default search (scenario #1). Similarly, the transferred size (MB) of the webpage is higher for Scenario #1 which results in a higher calculated CO₂ emission intensity in grams (g CO₂/kWh).
The constant 0.06 kWh/GB refers to electricity intensity of internet data transferred (Aslan et al. 2018), and the constant 0.033 kg CO₂/kWh is based on CO₂ emission intensity for the Finnish market as defined by the European Environment Agency (EEA) (European Environment Agency 2025).
Scenario
Transfer size, average (MB)
Requests (n), average
g CO₂/kWh
1. AI Overview & search features
2,97
119,16
0,0059
2. Web search filter (udm=14)
2,06
59,60
0,0041
Summary
Powering AI tools and models require immense energy resources
Tools like Google AI Overview can have both positive and negative impact on CO2 emissions
A default Google search can result in 44% more CO2 emissions compared to a text based search
Practitioners should make consumers aware of environmental implications
Thanks for reading 🤓
Thomas Granelund
thomas (at) djuptho.com +358 five 0 3296 438
Resources
Aslan, J. et al. (2018). Electricity Intensity of Internet Data Transmission: Untangling the
Estimates. Journal of industrial ecology. 22 (4), pp. 785–798.
European Environment Agency. (2025). Greenhouse gas emission intensity of electricity generation in Europe. Available at: https://www.eea.europa.eu/en/analysis/indicators/greenhouse-gas-emission-intensity-of-1